Vihren Atlas: A Code Behavior Map from Formal Concept Analysis
Vihren Atlas uses test scenarios, test names, and test coverage to make a map of software behavior.
Bug reports and change requests usually describe observable behavior rather than source locations. As a software engineer, before you can understand or change that behavior, you need to locate the code that implements it. Researchers call this task feature location (Dit et al., 2013).
Before LLMs and coding agents, feature location already took a substantial part of software maintenance work. In a study of ten experienced developers performing unfamiliar maintenance tasks, navigating among relevant fragments consumed an average of 35% of task time (Ko et al., 2006).
We have not yet conducted similar studies to understand how LLMs and coding agents have changed that work. However, several things are clear:
- Feature location is a critical element of the coding agent’s process.
- Incorrect feature location leads to problems: an agent can include irrelevant code or omit a relevant path while locating a behavior. Mistakes can lead to bloated context or worse, to gaps in the agent’s grasp of the codebase.
- An engineer doesn’t need to do feature location in a familiar codebase. But an agent starts each new task without a durable map of the repository, so it repeats the same investigations. A useful memory system would have to remain current as the code changes.
- Even though a lot of software development work is being delegated to agents, humans are the ones ultimately accountable. This means that feature location, as part of the broader topic of program comprehension, is still relevant for engineers and is becoming even more critical than ever. In 2025, CISA, DARPA, the NSA, and the U.S. Department of Defense formally described a growing “software understanding gap”: our capacity to produce software has outstripped our capacity to understand, validate, maintain, and secure it. (https://www.cisa.gov/resources-tools/resources/closing-software-understanding-gap)
In a series of later articles we will explore an approach to feature location as well as other topics of program comprehension based on collecting per-test coverage data. Before we get there, we must first describe the core idea which makes this possible - a way of processing the coverage data which will allow us to build a runtime map of the codebase. This is the topic of the present article.
Runtime maps for several open-source projects are available as a demo, called Vihren Atlas. The visualizations there represent the observed relation between tests and code. By the end of this article, you will know how to read them. Later articles will apply the map to feature location and other program-comprehension use cases.
From tests to an execution relation
Many CI pipelines collect coverage while tests run. Teams often reduce that data to a percentage that acts as a quality gate for code changes. The percentage is useful, but it hides which scenarios reached which code.
The raw data contains more than the percentage shows. Atlas starts with a relation between test cases and code:
test T executed line L
Aggregate coverage flattens this relation into “covered” or “not covered.” Per-test coverage keeps the scenario identity behind each covered line, so it maps scenarios to the code they execute. Previous work has used test executions and coverage matrices for software understanding (Cornelissen et al., 2007; Dreef et al., 2023). Atlas starts with the same raw relation and uses Formal Concept Analysis to organize it.
A small coverage matrix
To understand the rest we need a running example. Here is the coverage data for a key-value store that has four tests and six functions.
| Test | Open | hashKey | Get | Set | Delete | flushToDisk |
|---|---|---|---|---|---|---|
| TestGet | x | x | x | |||
| TestSet | x | x | x | |||
| TestDelete | x | x | x | x | ||
| TestPersistence | x | x | x | x |
From this matrix, you can already see several patterns:
- all four tests execute
OpenandhashKey; - the three write scenarios execute
Set; Get,Delete, andflushToDiskdistinguish narrower scenarios.
Even without meaningful function names, these execution footprints suggest where a behavior might live. If the functions were called f1 through f6, the matrix would still show clues in which function a particular behavior might be implemented.
A real project can contain thousands of tests and code ranges, so visual inspection stops working. Formal Concept Analysis gives us a way to organize the relation.
Formal Concept Analysis
Formal Concept Analysis (FCA for short) is an area of mathematics which studies objects, attributes, and a binary relation between them (Ganter and Wille, 2024). In FCA’s vocabulary, the code ranges in our example are the objects and the tests are the attributes.
The coverage matrix is called a formal context: a table that records which tests are related to which code ranges.
The key notion that FCA introduces is that of the formal concept: a set of code ranges and the tests that share them. The pair is closed when neither side can be expanded without changing the other:
- Every test covers every range in the concept
- If a line is covered by every test in the concept then it must belong to one of the concept ranges
- If a test covers all ranges in the concept then it must belong to one of the concept tests.
In the coverage matrix, you can picture a concept as a maximal solid rectangle of xs after reordering the rows and columns. Adding another row or column would introduce an empty cell.
The range set is called the concept’s extent. The test set is called the concept’s intent.
Start with TestSet. Its footprint is Open, hashKey, and Set. Which tests cover all three? TestSet, TestDelete, and TestPersistence do. Their common footprint is still Open, hashKey, and Set, so the set is closed. This is the write-path concept.
Six concepts in the example
The complete toy context contains six concepts, including the boundary concepts.
| Concept | Extent | Intent | Introduces | Reading |
|---|---|---|---|---|
| C1 | Open, hashKey | all four tests | Open, hashKey | shared store bootstrap |
| C2 | C1 + Set | TestSet, TestDelete, TestPersistence | Set, TestSet | write path |
| C3 | C1 + Get | TestGet | Get, TestGet | read path |
| C4 | C2 + Delete | TestDelete | Delete, TestDelete | deletion |
| C5 | C2 + flushToDisk | TestPersistence | flushToDisk, TestPersistence | persistence |
| C6 | all functions | no tests | - | bottom boundary: no test covers every function |
“Write path” and “persistence” are names we give to patterns in the tests and code. FCA supplies the structure, not those semantic labels.
Concepts form a behavior map
Now order the concepts by their extents. One concept sits above another when its code extent contains the other’s. The test intent moves in the opposite direction: as the extent gains ranges, the intent loses tests. The result is a mathematical structure, called a lattice. You can draw it as a directed acyclic graph.
For the key-value store, the hierarchy is:
                         C1
                  ┌──────┴──────┐
                  │             │
                  C2            C3
             ┌────┴────┐        │
             │         │        │
             C4        C5       │
             │         │        │
             └─────────┴────────┘
                       │
                       C6
The graph places larger code extents above smaller ones. C4 contains the complete deletion footprint, including inherited bootstrap and write code. C1 contains only the two functions common to all four scenarios.
Introduced extent and intent
A range or test can participate in several concepts, but it first enters the hierarchy at one concept. The Set function enters at C2; the concepts that also contain it (C4, C5, and C6) sit below C2. TestPersistence enters at C5; the concepts that contain it (C1 and C2) sit above C5. We call the ranges and tests that enter at a concept its introduced extent and introduced intent.
The toy lattice is small enough to draw. A real context is not: the number of concepts can grow exponentially with the number of tests and covered lines. But it turns out that the concepts that introduce code or tests grow linearly instead, so they are the practical subset to compute and store. FCA calls this subset the AOC-poset. Atlas uses it for the navigable map.
How Vihren Atlas builds the map
So far we considered a toy example. Next, we move to the real implementation. The toy example uses each function as an object. Real functions can contain several test-coverage patterns, and one pattern can continue across multiple statements. Atlas therefore starts below the function level.
Compress lines into ranges
For each covered source line, Atlas computes a coverage signature: the set of collected tests that executed that line. It merges consecutive lines in the same file only when their coverage signatures are identical. Each maximal consecutive run becomes one range.
For example, if 50 adjacent lines all have the signature {TestGet, TestSet}, Atlas represents them as one range. If that signature appears again after a line with a different signature, Atlas keeps a separate range. This preserves the observed line-to-test relation while giving FCA fewer objects to process.
Keep the introducer hierarchy, not the full lattice
The full lattice is useful for the explanation, but it is not practical to compute, store, or visualize at repository scale. Atlas computes the AOC-poset. It retains every concept that introduces at least one range or test and deduplicates coincident object and attribute concepts. Atlas follows the Hermes-style AOC-poset construction described by Berry et al., 2014. It orders concepts by test-intent inclusion and computes direct hierarchy edges by transitive reduction.
Project the concept hierarchy onto files
The concept hierarchy is useful, but readers still need to reach its evidence from the source tree. Atlas therefore provides two related views:
- concept pages preserve extents, intents, introducers, and direct FCA relationships;
- the code map projects concepts that introduce ranges onto source files.
Atlas then projects the concept hierarchy into a file topology. That topology gives readers a path through the repository:
- Files belong to one Group when they are connected through concepts that introduce code in more than one file.
- Direct parent-child concept relationships create directed links between those groups.
- Cyclically linked groups are collapsed into Clusters.
- Weakly connected components of the resulting acyclic graph become Projects.
The resulting navigation is:
Project → Cluster → Group → File → Range
Reading a real Atlas map
Open the pinned Temporal Server release. It is a partial map built from collected unit and integration tests. The release contains 12,775 tests, 43,914 covered ranges, 25,741 retained concepts, and 1,549 covered files.
The file map below connects tools/common/github/runs.go to the concepts
that introduce its covered ranges and to the exact tests those concepts
introduce.
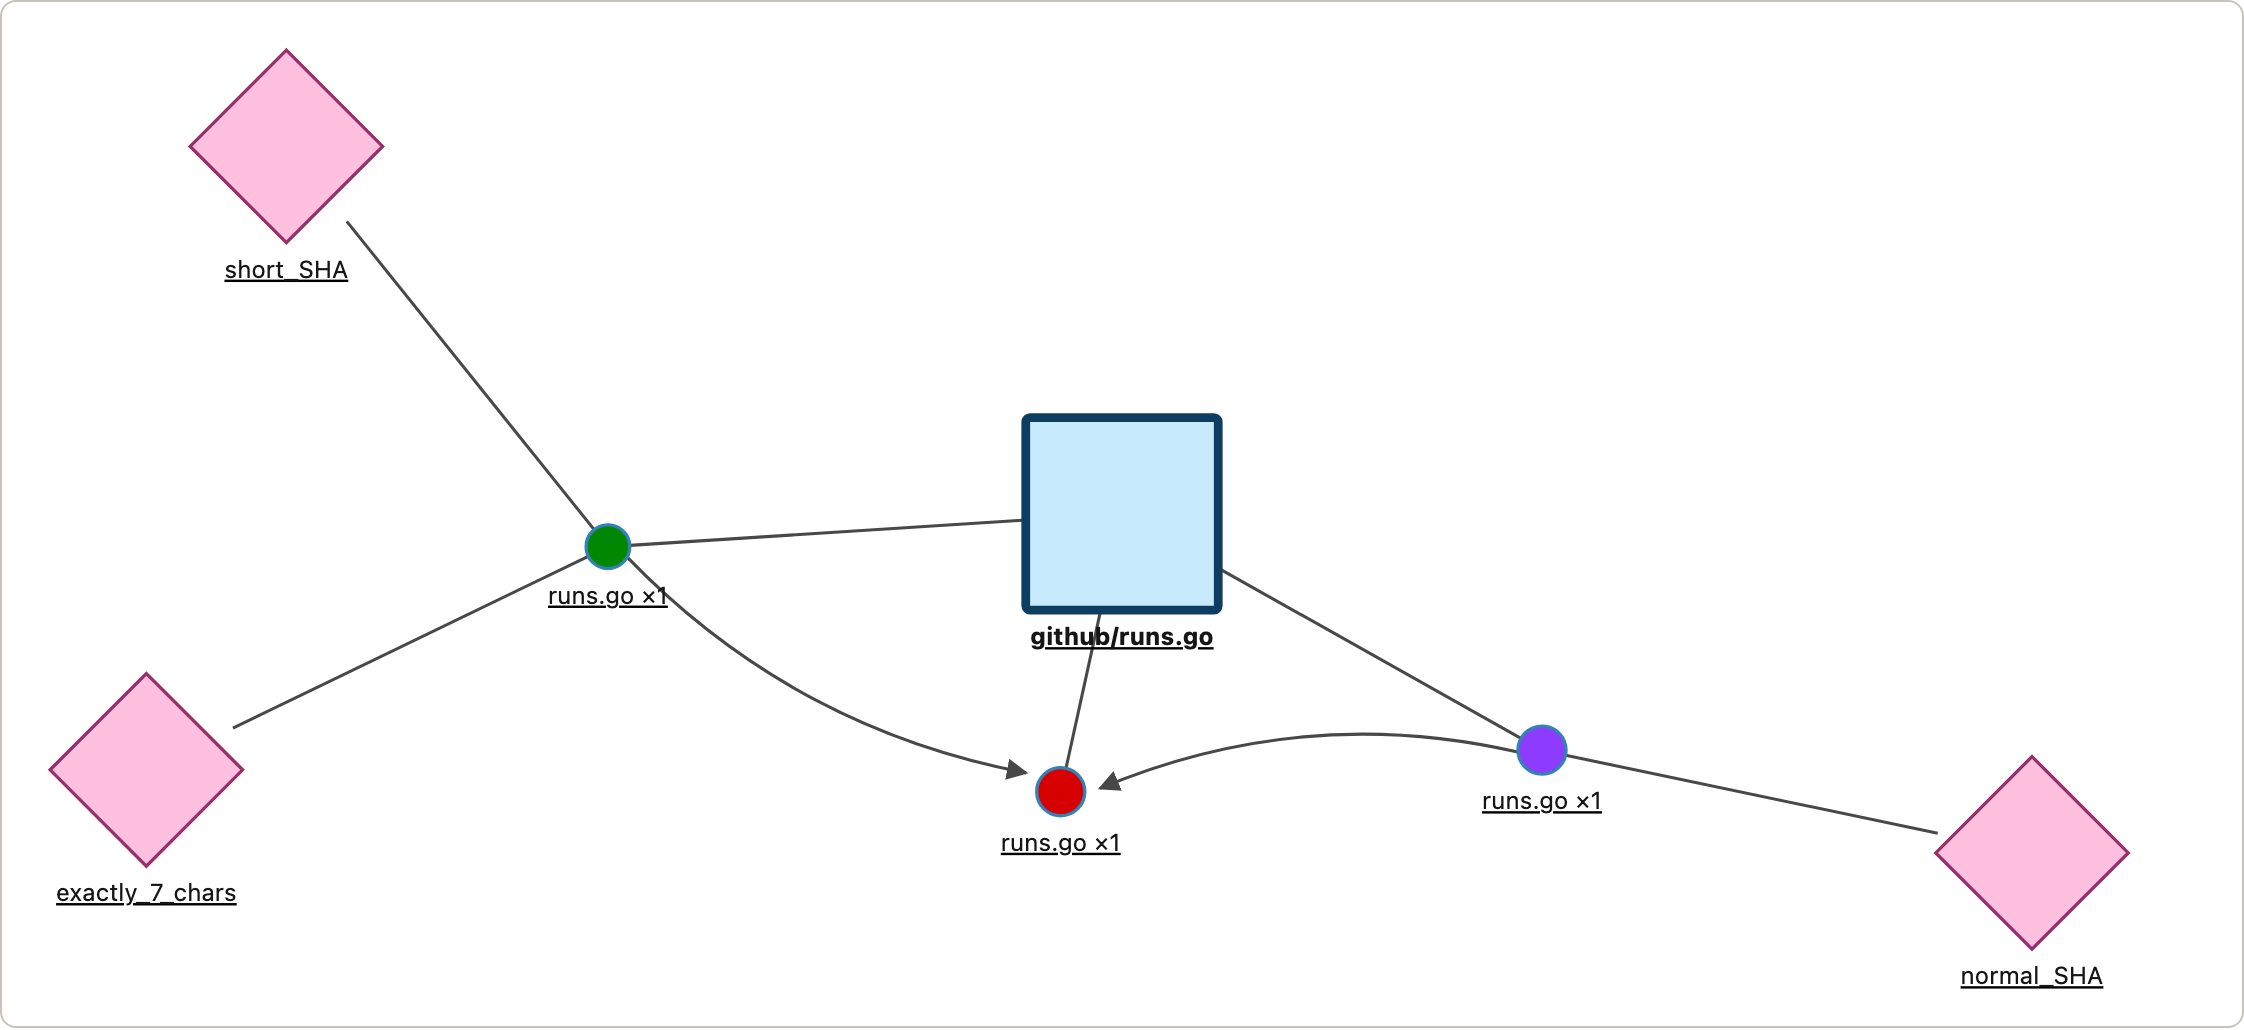
Now open the live joint-frontier concept moving_window_average.go ×1 and read the page as a worked example.
The page separates two ledgers:
- Introduces: one test and one two-line range in
common/aggregate/moving_window_average.go; - Contains: the complete concept extent of 457 ranges, 3,085 covered lines, and 151 files, together with its one-test intent.
The introduced source is the return 0 branch used when the moving average has no records. The introduced test is the exact Temporal subtest TestDeepHealthCheck/no_records_reports_healthy_(aggregator_returns_0). Because that is the only test in the intent, the extent contains its entire collected footprint—not just the two lines that make this concept a joint frontier.
That difference is why Atlas shows both “Introduces” and “Contains.” The two-line range identifies the evidence that enters at this concept. The much larger extent shows all code shared by its intent.
From this page, follow broader and narrower concepts, the files where they introduce ranges, and the tests they introduce. A child code frontier in windowed_tdigest.go, for example, has two tests in its intent, contains 23 covered lines in one file, and introduces two lines but no test. The transition narrows the code extent while enlarging the test intent.
What becomes visible
This map adds a relation that the directory tree does not contain. You can ask:
- Which collected tests executed this range?
- Which ranges share its complete test signature?
- Where does this range enter the concept hierarchy?
- Which code is common to a larger set of test scenarios?
- Which broader footprints contain this shared code?
- Which files are connected because one concept introduces ranges in both?
Text search, language servers, static analysis, and code reading remain necessary. Atlas does not replace them; it adds repeatable execution evidence to the investigation.
This is where the map connects back to coding-agent work. An agent investigating an unfamiliar behavior can use it as another source of evidence instead of inferring runtime relationships only from names and nearby references. Feature location is one natural application, and the current Atlas map provides the building blocks for it.
Explore Atlas
You can open the Atlas catalog, choose a pinned repository, and explore the map. As you do so, ask yourself:
- Did the map give you clear information about a system part that you did not know?
- Did the map show a dependency that many scenarios use or a feature boundary that you did not know before?
- Could the map help a code agent find the applicable code and tests with less exploration?
- Could it help you find areas of the codebase that need refactoring or better tests?
The interesting thing is that the test suite already contains the raw material for this map. It records traces of the behavior the system has exercised. FCA gives those traces a structure, and Atlas is an attempt to make that structure available for exploration.
At Vihren we believe dynamic analysis should play a much larger role in program comprehension. Static analysis has given us powerful ways to reason from the structure of source code. Execution gives us another view, grounded in what the system actually does. Compared with static analysis, this view is still underexplored, especially as a way to help both engineers and coding agents understand unfamiliar repositories.
What excites us is the possibility that a test suite can become more than a quality signal. It can become one of the maps through which a codebase is understood by both product and engineering teams.
Atlas is still an exploration of that possibility. We still need broader use cases, meaningful benchmarks, and experience with how these maps fit into real engineering work. But the direction is promising enough to pursue, and we want to find out how far it can go. Feature location will be the first application we pursue; later articles will explore pull-request review and repository-level code understanding.
If this direction resonates with the problems you face, join us on that journey. We are looking for design partners who would help us shape Atlas into a useful product. If you want to construct runtime maps for your internal repositories and explore what dynamic evidence can add to feature location, code review, and agent-assisted software development, then let’s talk. You can contact Vihren if you would like to work with us.
References
- Berry, A., Gutierrez, A., Huchard, M., Napoli, A., and Sigayret, A. (2014). Hermes: a simple and efficient algorithm for building the AOC-poset of a binary relation.
- CISA, DARPA, NSA, and U.S. Department of Defense (2025). Closing the Software Understanding Gap.
- Cornelissen, B., van Deursen, A., Moonen, L., and Zaidman, A. (2007). Visualizing Testsuites to Aid in Software Understanding.
- Dit, B., Revelle, M., Gethers, M., and Poshyvanyk, D. (2013). Feature location in source code: a taxonomy and survey.
- Dreef, K., Palepu, V. K., and Jones, J. A. (2023). Exploring granular test coverage and its evolution with matrix visualizations.
- Ganter, B. and Wille, R. (2024). Formal Concept Analysis.
- Ko, A. J., Myers, B. A., Coblenz, M. J., and Aung, H. H. (2006). An Exploratory Study of How Developers Seek, Relate, and Collect Relevant Information during Software Maintenance Tasks.